

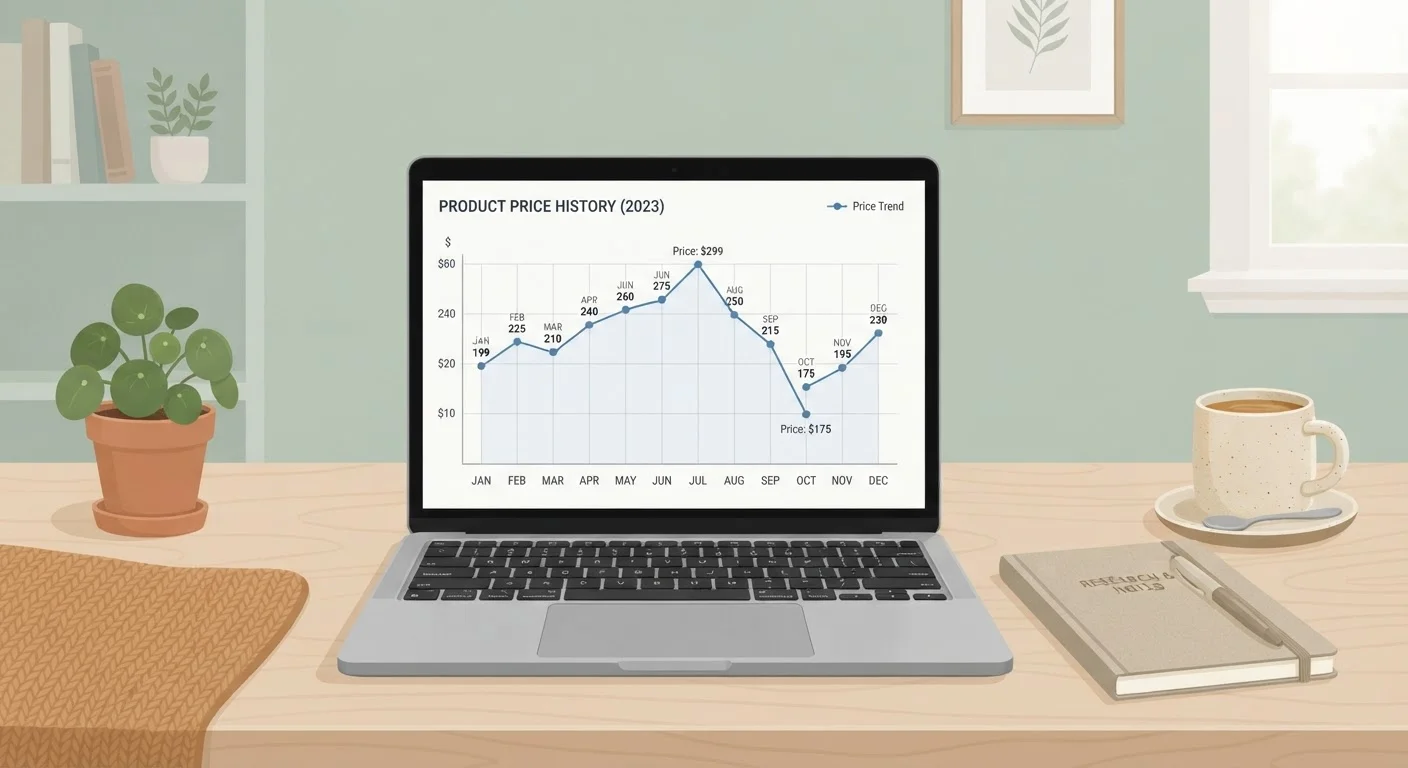
Why Price History Data Belongs in Every Purchase Decision
A price tag tells you what something costs today. A price history chart tells you whether that number means anything. Without historical context, you have no reliable way to distinguish a genuine discount from a routine price point - or a temporary spike from a stable floor.
Retailers are sophisticated about how they display prices. Phrases like "was $X" or "X% off" are calculated to create urgency, but they reference a comparison price that may have been set artificially high or may reflect a short-lived promotional price rather than a true regular price. Price history tools cut through this by recording what the item actually sold for, day by day, over months or years.
This is especially relevant for higher-stakes purchases. Before committing to anything meaningful, run through the pre-purchase research checklist to confirm the product fits your needs - then layer in price history to confirm the timing fits your budget. And if you want the full picture on how retail pricing cycles work, the complete guide to deals and timing covers the broader landscape.
Browser-based price tracker extension
Automatically overlays price history data on product pages while you browse major retail sites.
Dedicated price history website
Lets you search any product URL or name and view its full historical pricing chart without installing software.
Spreadsheet or notes app
Records your target price, historical low, and decision rationale for comparison shopping across multiple items.
How to Read the Chart: What Each Feature Signals
Once you have a chart in front of you, here's how to interpret what you're seeing:
- Peaks: Usually coincide with product launches, restocking after a shortage, or pre-sale inflation. A price near a historical peak is a price worth questioning.
- Valleys (the floor): Represent the lowest the market has gone. If a price is currently at or near the floor, that's meaningful - but check whether the valley was a brief one-day anomaly or held for days or weeks. Anomalies are often hard to catch in real time.
- Flat stretches: Suggest the item has a stable "everyday" price. These are useful anchors - if the current price matches a long flat stretch, it's probably fair value rather than a deal or a rip-off.
- Stair-step drops: Common with electronics and seasonal goods. The price drops noticeably, holds for a period, then drops again. This pattern often signals more drops to come, especially if a newer model or season is approaching.
Inflation Before a Sale Is Real
Retailers sometimes raise a product's listed price in the weeks before a major sale event, then discount it back to near its original level - making the 'deal' look bigger than it is. A price history chart is the most reliable way to see through this tactic. Never assume a sale-day price is the lowest the item has ever been.
Once you've read the chart, the step-by-step process below walks you through the full decision workflow - from finding a tool to setting a price alert.
Set a Price Drop Alert
Most price tracking tools let you enter a target price and receive an email or browser notification when the item hits that threshold. This removes the need to check manually and keeps you from impulse-buying at a price that hasn't yet reached its historical low.
Step-by-Step: Reading a Price Chart Before You Buy
What you will need
Find or install a price tracking tool
Price history data is not displayed by default on most retail sites - you need a third-party tool to surface it. Browser extensions are the most convenient option: install one, and the chart appears automatically on any compatible product page. If you prefer not to install software, several dedicated websites accept a product URL and display its full price history in seconds. Either approach works; the key is using one consistently before any significant purchase.
Pull up the chart and set the time range to at least 6 months
Open the product page or paste the URL into your tracking tool. Most charts default to 30 or 90 days - change this to 6 or 12 months before drawing any conclusions. A longer window shows seasonal patterns, pre-holiday spikes, and post-event drops that shorter views hide completely.
Identify the historical low and average price
Most tools display the all-time low, 90-day low, and average price as summary figures alongside the chart. Note all three. The all-time low is the floor - the price point the item has reached at least once. The average tells you what a normal, non-sale price looks like. If the current price sits near the average or above it, you are not seeing an unusual deal. If it sits near or below the all-time low, that is genuinely rare and worth acting on - if the timing is right for you.
Look for price spike patterns before major sale events
Scan the chart for sharp upward moves that precede known retail events - major shopping holidays, end-of-season clearances, or new model releases. These spikes often represent temporary price increases that inflate the apparent discount once the sale begins. If you see a spike in the two to four weeks before a past sale date, assume the same pattern may repeat. This is one of the most actionable insights a price chart can give you.
Assess price volatility and decide whether to wait
Step back and look at the overall shape of the chart. A flat or narrow-range chart means the price rarely moves - waiting likely won't help much, and if the current price is near the average, buying now is reasonable. A highly volatile chart with frequent swings of 20% or more signals that patience often pays. In those cases, consider setting a price alert at or just above the historical low rather than buying at the current price. This connects directly to the logic explored in why waiting a few weeks can change the price dramatically.
Set a price alert and document your reasoning
If you decide to wait, set an alert at your target price so you don't have to monitor manually. Log the product name, current price, historical low, your target price, and your reasoning in a notes app or simple spreadsheet. This discipline prevents you from rationalizing a purchase later just because you've forgotten the context. When the alert fires, re-check the chart briefly to confirm the drop is genuine before buying.
After following these steps, you'll have a clear picture of whether the current price is worth acting on, or whether a pre-purchase timing checklist suggests waiting a bit longer.
The content on this site is provided for informational purposes only and should not be considered a substitute for professional advice. While we strive to provide accurate and up-to-date information, we make no guarantees regarding its completeness or accuracy. Always consult a qualified professional for advice specific to your circumstances before making any decisions.